How to view page source online
To view page source online, submit a public webpage address or switch to Text mode to format raw markup directly in your browser.
- Enter the full public webpage URL (including
https://) in the Website URL field, or select the Text tab to paste HTML markup you already have. - Select View Source to request the origin HTML document and populate the numbered code workspace.
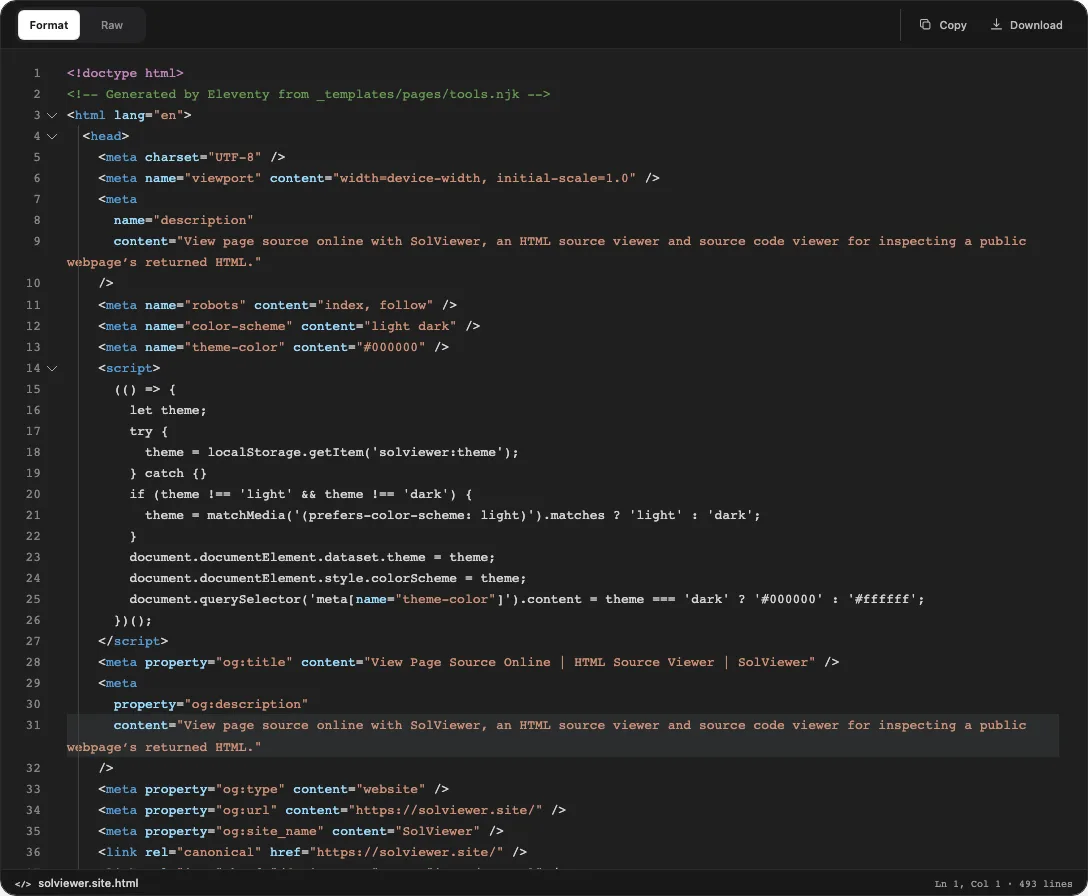
- Switch between Format (Prettier-indented markup with collapsible tag blocks) and Raw (the exact line breaks sent by the server), or use Copy and Download to save the HTML file.
- Scroll down to the ON-PAGE SEO REPORT panel directly below the editor to inspect the Core SEO score, page facts, metadata checks, and detected technologies generated from the same HTTP response.
Reading your results
View Source separates what the server transmitted over the network from what a browser later builds in memory. Understanding each area of the workspace helps you verify whether tags exist in the initial HTTP payload.
| Workspace component | What it displays | When to use it |
|---|---|---|
| Format view (default) | Reflows the retrieved HTML with consistent indentation, syntax highlighting, and interactive fold controls (⌄) on multi-line elements. |
Use when minified or single-line production HTML makes it difficult to trace nested <head> tags, JSON-LD blocks, or layout containers. |
| Raw view | Prints the exact character stream and line breaks returned in the HTTP response body without re-indenting. | Use when debugging server template whitespace, exact line numbers from parser warnings, or byte-level payload structure. |
| Workspace footer | Displays the derived filename (such as example.com.html or pasted-source.html) beside the line counter (Ln 1, Col 1 · N lines). |
Use to confirm whether you are reading a live URL response or a local pasted snippet and to gauge document length. |
| Copy & Download actions | Copies the active document to your clipboard or saves a standalone .html file named after the hostname (for example, example_com.html). |
Use when archiving a snapshot of the server response or sharing markup with a developer. |
| On-page SEO report pane | Evaluates the retrieved document across 8 core categories (SEO Basics, Document Structure, Open Graph & Social, Structured Data, Internationalization, Images, Links, and Security Headers) plus Discovery files, HTML syntax, Response headers, and Technology detection. | Use immediately after inspecting source code to verify whether titles, canonicals, noindex directives, and schema objects parse cleanly without running a second network fetch. |
Important capability boundary: View Source fetches and parses only the initial HTML document returned by the server. It does not execute client-side JavaScript, bundle external CSS or images into downloads, or expose private backend application code (such as PHP, Python, Ruby, Node.js, or database queries).
Worked example: Inspecting a public webpage response
When you inspect a public URL in View Source, you can verify critical technical SEO and rendering signals in under a minute by cross-checking the numbered HTML against the integrated audit below it.
Suppose a page returns the following server HTML in the <head> section:
<!doctype html>
<html lang="en">
<head>
<meta charset="UTF-8" />
<meta name="viewport" content="width=device-width, initial-scale=1.0" />
<title>Technical Documentation & API Reference | Example</title>
<meta name="description" content="Explore endpoint specifications, authentication headers, and webhook payloads." />
<link rel="canonical" href="https://example.com/docs/api/" />
<script type="application/ld+json">
{"@context":"https://schema.org","@type":"WebPage","name":"API Reference"}
</script>
</head>
<body>
<main>
<h1>API Reference</h1>
<div id="client- interactive- explorer"></div>
</main>
</body>
</html>Here is how to interpret this response in the workspace:
- Verify server-delivered metadata (lines 5–8): The
<title>,meta[name="description"], andlink[rel="canonical"]tags are present directly in the server response. Crawlers that do not execute JavaScript—or that defer rendering—will immediately see these signals. - Spot client-rendered placeholders (line 15): The
<div id="client-interactive-explorer"></div>container is empty in View Source. If users see an interactive table in their browser, JavaScript injected it after page load. Anything inside that container is absent from the initial HTML response. - Cross-check the On-Page SEO Report: Below the editor, the report summarizes HTML size, Elements count, Words count, and HTTP status, then scores the Core SEO checks and expands evidence panels for
Discovery files,HTML syntax, andResponse headers.
View Source vs. Inspect Element vs. SolViewer
Developers and SEOs frequently confuse View Page Source with Inspect Element (DOM Inspector). Although both open code in a browser, they represent two different stages of a webpage's lifecycle.
| Feature / Signal | SolViewer View Source | Browser View Source (Ctrl+U / Cmd+Opt+U) |
Browser Inspect Element (DevTools Elements) |
|---|---|---|---|
| Data source | Raw HTTP response body retrieved from the public origin URL. | Raw HTML cached from the current browser tab's initial network response. | Live Document Object Model (DOM) tree after HTML parsing and JavaScript execution. |
| JavaScript execution | Never executes page scripts; shows only server-delivered markup. | Never executes page scripts. | Reflects all DOM mutations, injected tags, and hydrated SPA components. |
| Syntax formatting | Toggle between Prettier-formatted indentation (with code folding) and Raw lines. | Shows unformatted raw source only; minified pages appear on a single line. | Shows an auto-normalized, collapsible DOM tree (fixes broken tags automatically). |
| Mobile browser support | Works directly in iPhone Safari, iPad, and Android browsers via a URL form. | Missing in iOS Safari; view-source: prefix in Android Chrome often triggers a web search. |
Requires connecting the phone to a desktop computer via USB remote debugging. |
| Integrated SEO & header evidence | Includes Core SEO checks, JSON-LD validation, discovery probes, and response headers. | None; requires manual searching through raw text. | Requires switching between Elements, Network, and Lighthouse panels. |
Common problems and fixes
When the source code you retrieve does not match what you expect to see in a browser tab, use these symptom-to-fix diagnostics:
- View Page Source is missing or disabled on right-click.
Cause: The webpage attached a JavaScript listener to thecontextmenuevent (such asevent.preventDefault()) to block the default browser menu.
Fix: Paste the public URL into SolViewer above. Client-side event listeners only run inside a rendered browser tab and cannot block an independent HTTP request to the server. - Typing
view-source:on Android or iPhone searches Google instead of showing code.
Cause: Mobile Safari lacks a native View Source command, and mobile Chrome treatsview-source:https://...in the omnibox as a search query unless you select the exact URL suggestion.
Fix: Bookmark this page on your phone and paste the URL into the form. You get line-numbered, foldable HTML without installing a mobile extension or bookmarklet. - Headings, links, or meta tags visible in DevTools are missing from View Source.
Cause: Single-page applications (React, Vue, Angular, Next.js CSR) often ship an empty HTML shell and inject content in the browser after JavaScript bundles load.
Fix: Check whether your root container looks like an empty mount node:
If critical SEO metadata (`<title>`, canonical, `meta name="robots"`, or JSON-LD) is missing from View Source, move those tags to server-side rendering (SSR) or static site generation (SSG) so crawlers receive them in the initial response.<div id="root"><!-- empty until client bundle executes --></div> - Minified HTML appears as one giant horizontal line in raw source.
Cause: Production build pipelines and CDNs strip line breaks and indentation to reduce transfer bytes.
Fix: Leave SolViewer on the default Format tab to automatically indent nested elements and enable fold arrows (⌄), then switch to Raw only when you need to check exact unformatted line breaks. - You expected to see PHP, Python, or database code.
Cause: Server-side languages execute on the origin host and output standard HTML before sending the response over HTTP.
Fix: Use View Source to inspect the generated HTML output only. Backend source code is never transmitted to public visitors unless a server is misconfigured. - The page opens in your browser, but the URL fetch fails here.
Cause: The target page requires a logged-in session cookie, sits on a private intranet/localhost address, or uses a firewall/bot challenge that blocks automated HTTP clients.
Fix: Confirm the URL is publicly accessible without authentication. If the page is behind a login or local dev server, copy the markup from your browser and switch this tool to the Text tab to format and audit it locally.
Viewing page source on iPhone, iPad, and Android
Mobile browsers strip out desktop developer panels to save screen space, making quick HTML checks difficult when you are away from a workstation. Safari on iOS and iPadOS has no built-in View Source button unless you install a third-party Shortcut or connect the device to a Mac. On Android, typing view-source: before a URL in Chrome frequently defaults to a search engine query if a space is auto-inserted or if you tap the primary search action.
SolViewer solves mobile source inspection in a standard browser tab without requiring an App Store download, browser extension, or desktop tether. When you submit a URL from a phone:
- The origin fetch happens server-side and returns the raw HTML document to your mobile screen.
- Prettier formatting wraps and indents deeply nested tags so you do not have to scroll thousands of pixels horizontally on a narrow viewport.
- Line-level fold buttons (
⌄) let you collapse large inline<svg>icons,<style>blocks, or navigation menus to jump straight to the content or metadata you are debugging.
How this check works
In URL mode, SolViewer sends an HTTP/HTTPS request to the public address you provide, records the status code, redirect chain, and response headers, and returns the raw HTML body to your browser. In Text mode, the markup you paste stays entirely in your browser memory without making a network request.
Once the HTML is loaded, the editor highlights tags, attributes, strings, comments, and doctypes while escaping all markup so embedded scripts in the remote page never execute in your session. Simultaneously, the client-side analyzer parses the document with DOMParser to populate the on-page SEO report and scan for 30+ common technology signatures (such as WordPress, Shopify, Next.js, Nuxt, React, Vue, Tailwind CSS, Cloudflare, and Google Tag Manager). For desktop browser shortcuts on an already-open tab, see Mozilla's documentation on the Firefox View Source tool.
All live URL requests follow the SolViewer public retrieval limits.
Frequently asked questions
Can I view page source on an iPhone or Android without an app?
Yes. Open SolViewer in Safari, Chrome, or Firefox on your phone, paste the public URL, and select View Source. You receive the numbered, formatted HTML and the on-page SEO report directly in your mobile browser without installing an app or extension.
Why does View Source look different from Inspect Element?
View Source shows the initial HTML text sent by the web server before any scripts run. Inspect Element shows the live DOM tree after the browser has fixed malformed tags and executed JavaScript. If a site uses client-side rendering, elements visible in Inspect Element may not exist in View Source.
What is the difference between Format and Raw mode?
Raw mode displays the exact characters and line breaks returned by the server, which is often minified onto a single line on production websites. Format mode runs Prettier's HTML parser in your browser to indent nested tags and add code-folding controls while preserving the document's element order.
Does View Source execute JavaScript or track my session on the target site?
No. SolViewer retrieves the static HTML response over HTTP and renders it as escaped code text. Scripts inside the fetched page are never executed, and your browser cookies for that external domain are never sent.
Can View Source reveal PHP, backend code, or hidden passwords?
No. Web servers execute backend code (such as PHP, Python, Ruby, or Node.js) before sending the response. View Source only displays the public HTML output that the server transmits to a visitor.
How can I view HTML source for a local file or a page behind a login?
Switch the input selector above the form from URL to Text, then paste your HTML markup. Text mode formats the code, enables folding, and runs the on-page HTML audit locally in your browser without sending the markup to a server.
Related tools
- SEO Checker — run a full 14-category technical and on-page SEO audit with bounded network checks for canonicals, hreflang return links, and Open Graph images.
- HTML Viewer — paste HTML markup to render a live visual preview inside a sandboxed iframe with a JavaScript on/off toggle.
- HTML Extractor — strip all HTML tags, scripts, and styles to extract clean, readable body copy and word counts.
- HTTP Header Checker — inspect redirect hops, status codes, HSTS, CSP, cookies, and
X-Robots-Tagheaders for any public URL.
Public URL requests follow the shared fetch limits on the About page.